


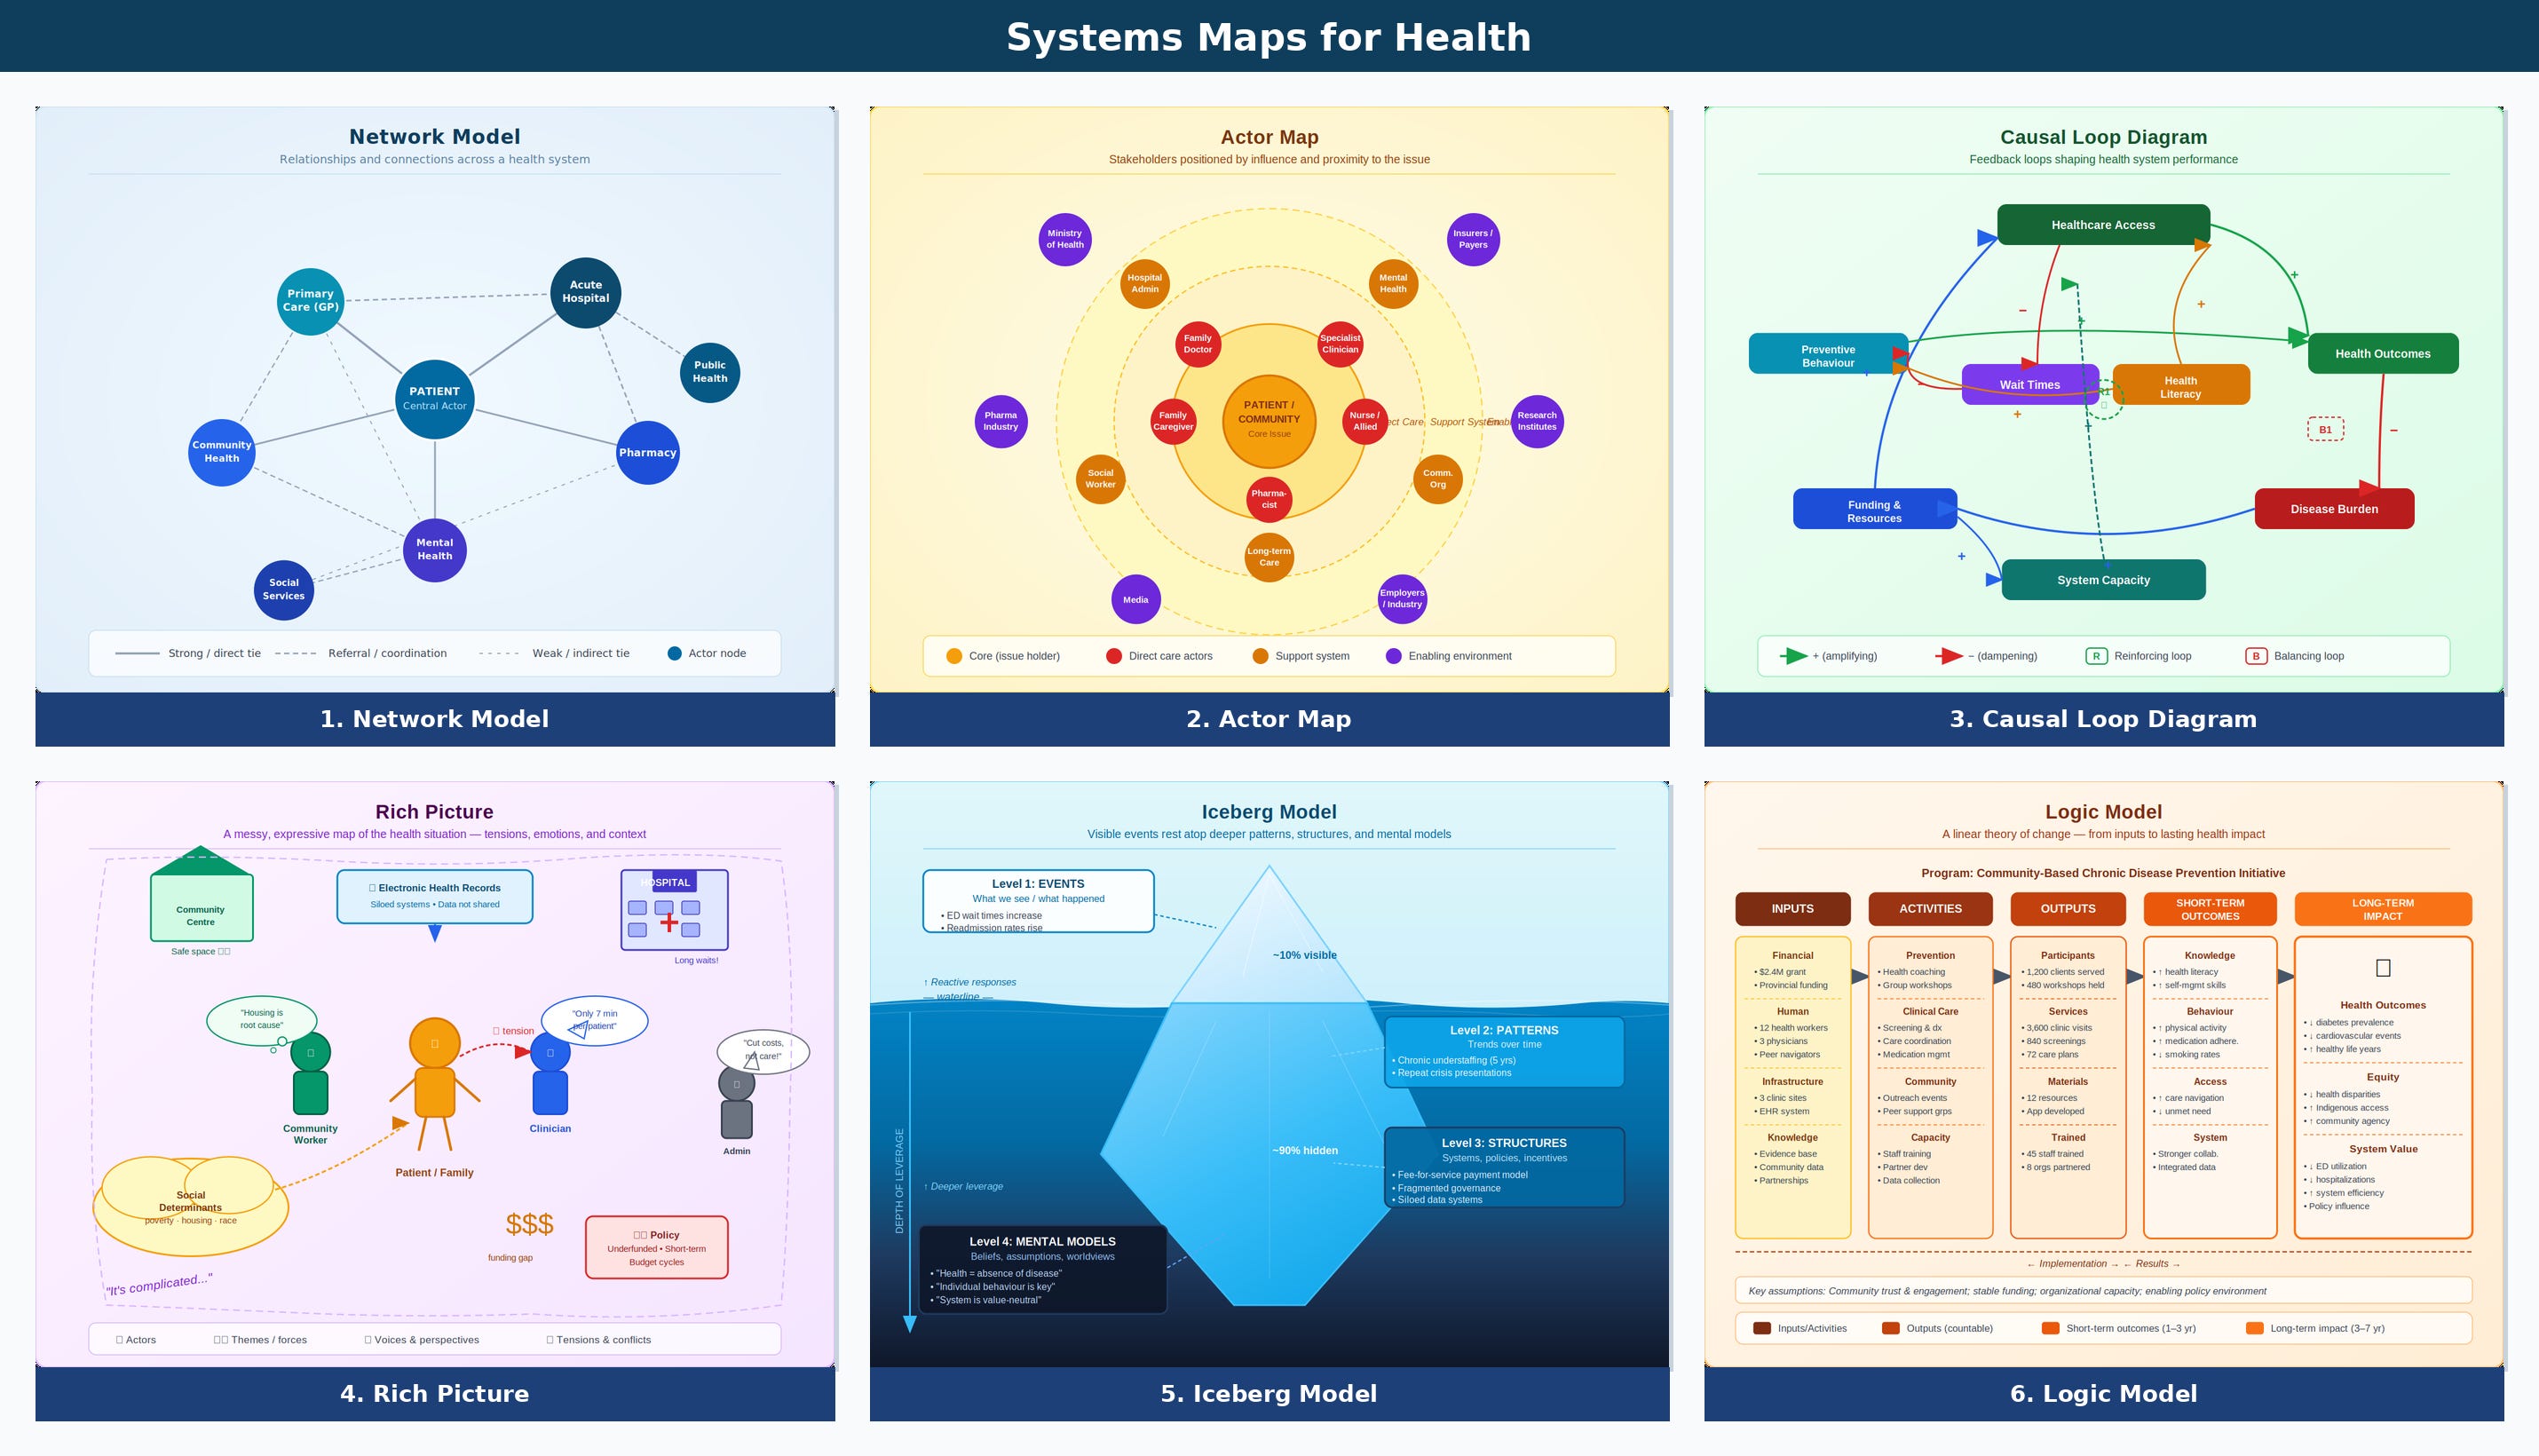
Among the more misunderstood aspects of practical systems thinking is the reliance on maps and models to show system properties. They are a means to gain perspective on the complexity of the situation you’re working with.
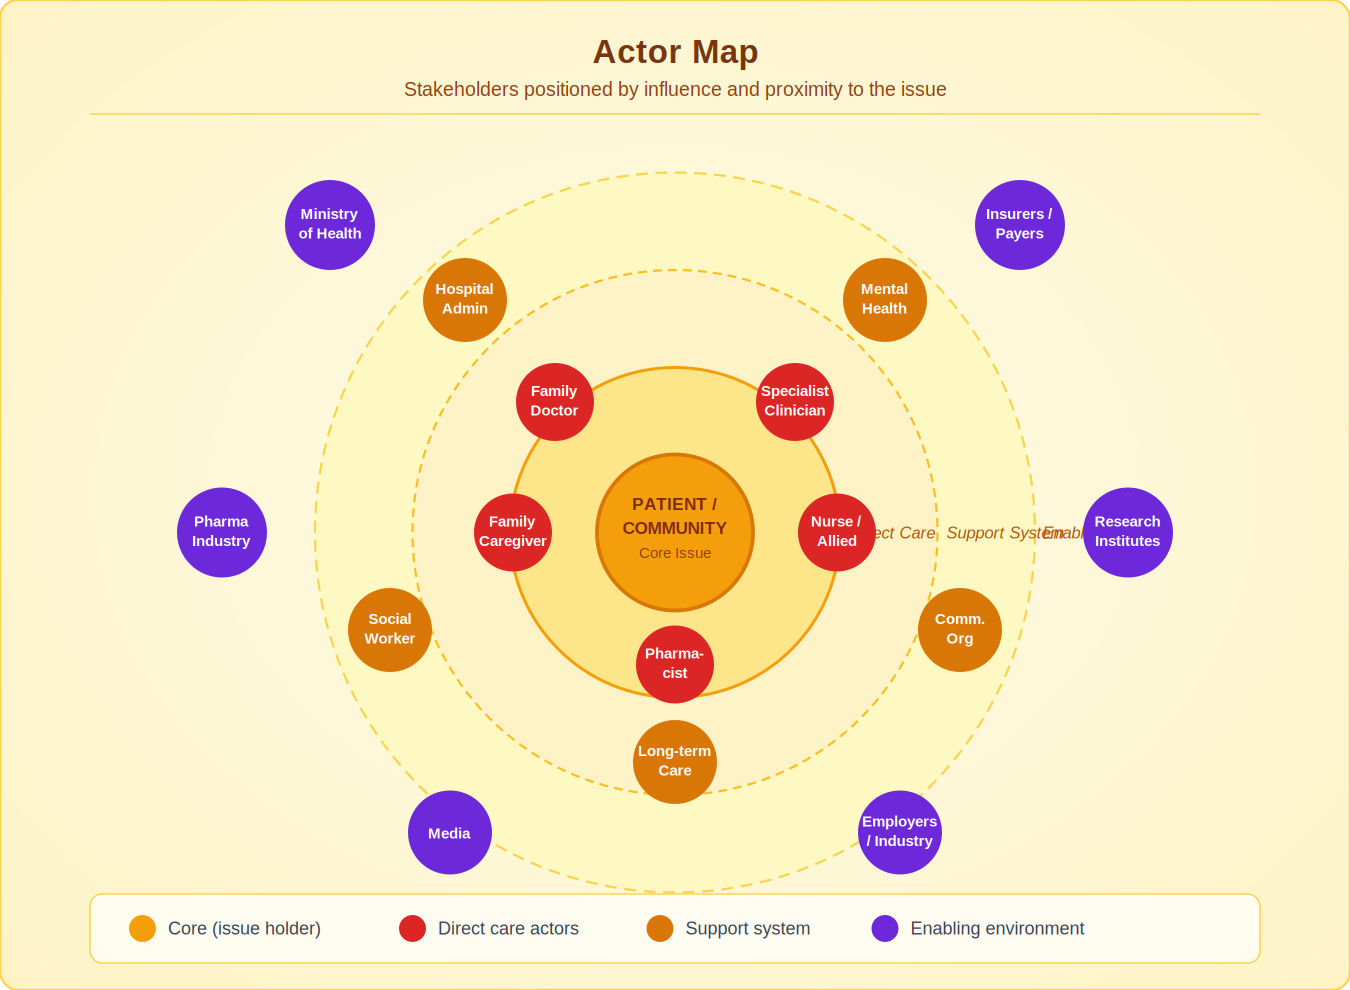
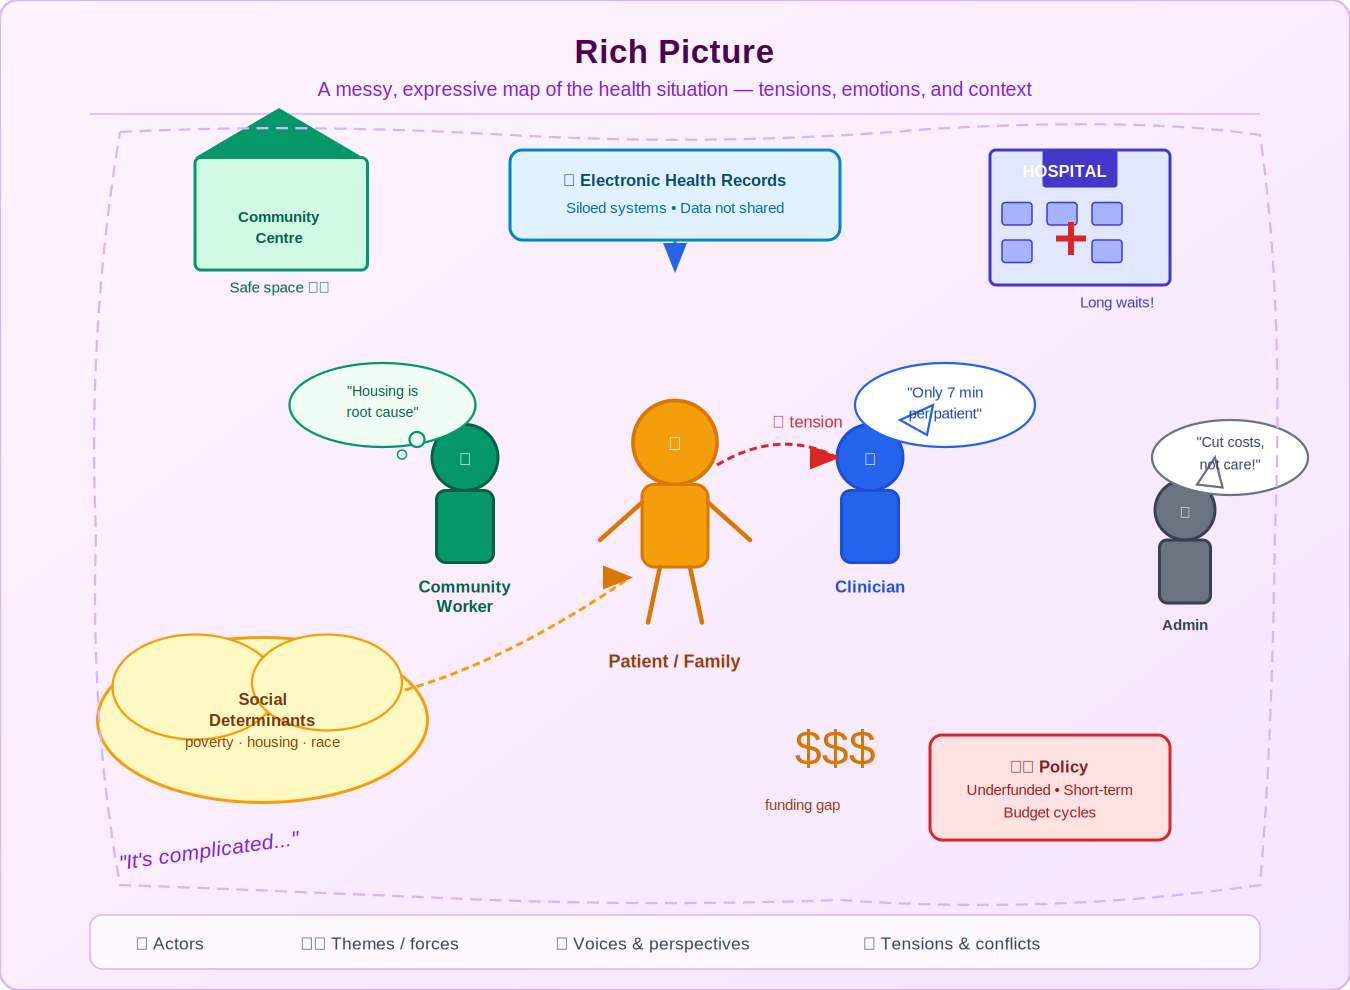
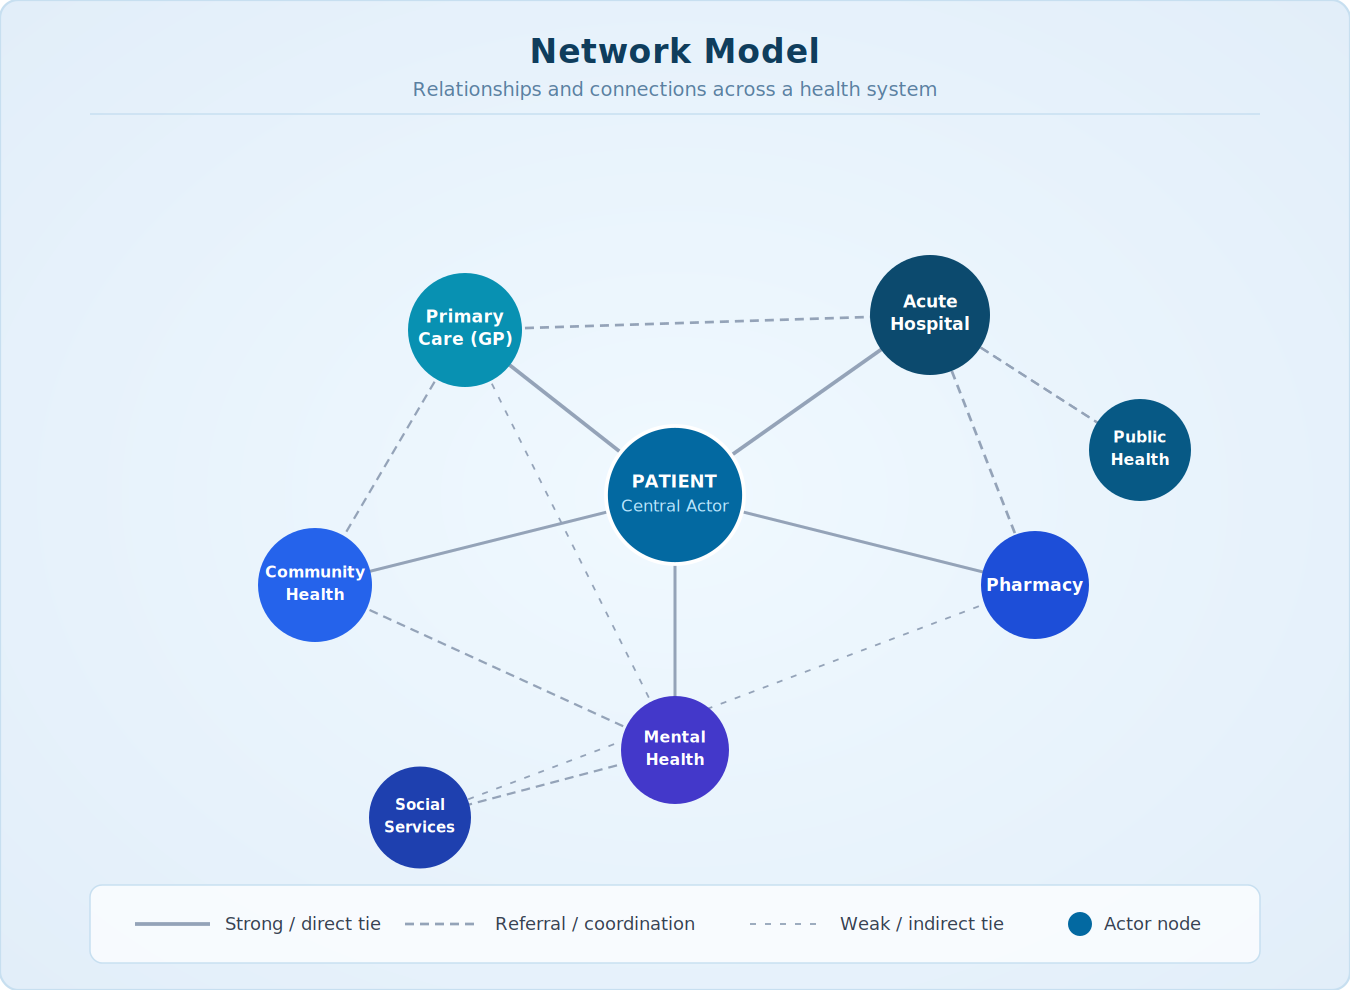
You might have heard of terms like system dynamics models, causal loop diagrams, actor or network maps, or rich pictures. These are all forms of visualization that allow us to “see systems.” Systems diagrams are an important part of designing for and within systems.
These methods and tools are topographical maps for the systems that you’re working with. Just like a National Geographic Atlas, the same territory can be mapped using different conventions, styles, and boundaries. This is the first step toward understanding systems and designing with and for them.
Working Definitions
There are many different terms used in systems thinking, often without a practical focus. I offer the following definition for those interested in designing health-oriented systems: thinking about systems involves identifying and understanding relationships among things and their implications for what has meaning and value within a given context. see: censemaking
Three core concepts underpin this practical definition. Relationships are connections between two or more things that affect one another. Context refers to a space, time, and situation with some kind of boundaries, which can be drawn more broadly (markets, regions) or more narrowly (a craft, a role) depending on the interests and intentions involved. Finally, perspectives matter because what has meaning and value is subjective and highly dependent on context — our intentions and purpose in defining a system shape what that system is and is not. Together, these three elements — relationships, context, and perspective — provide the foundation for our design efforts in creating products, services, and policies with impact.
System Mapping
What a system map does is connect what we are seeing and experiencing through data and visualize it in space. It creates a multi-dimensional model of the contexts, perspectives, and relationships we see.
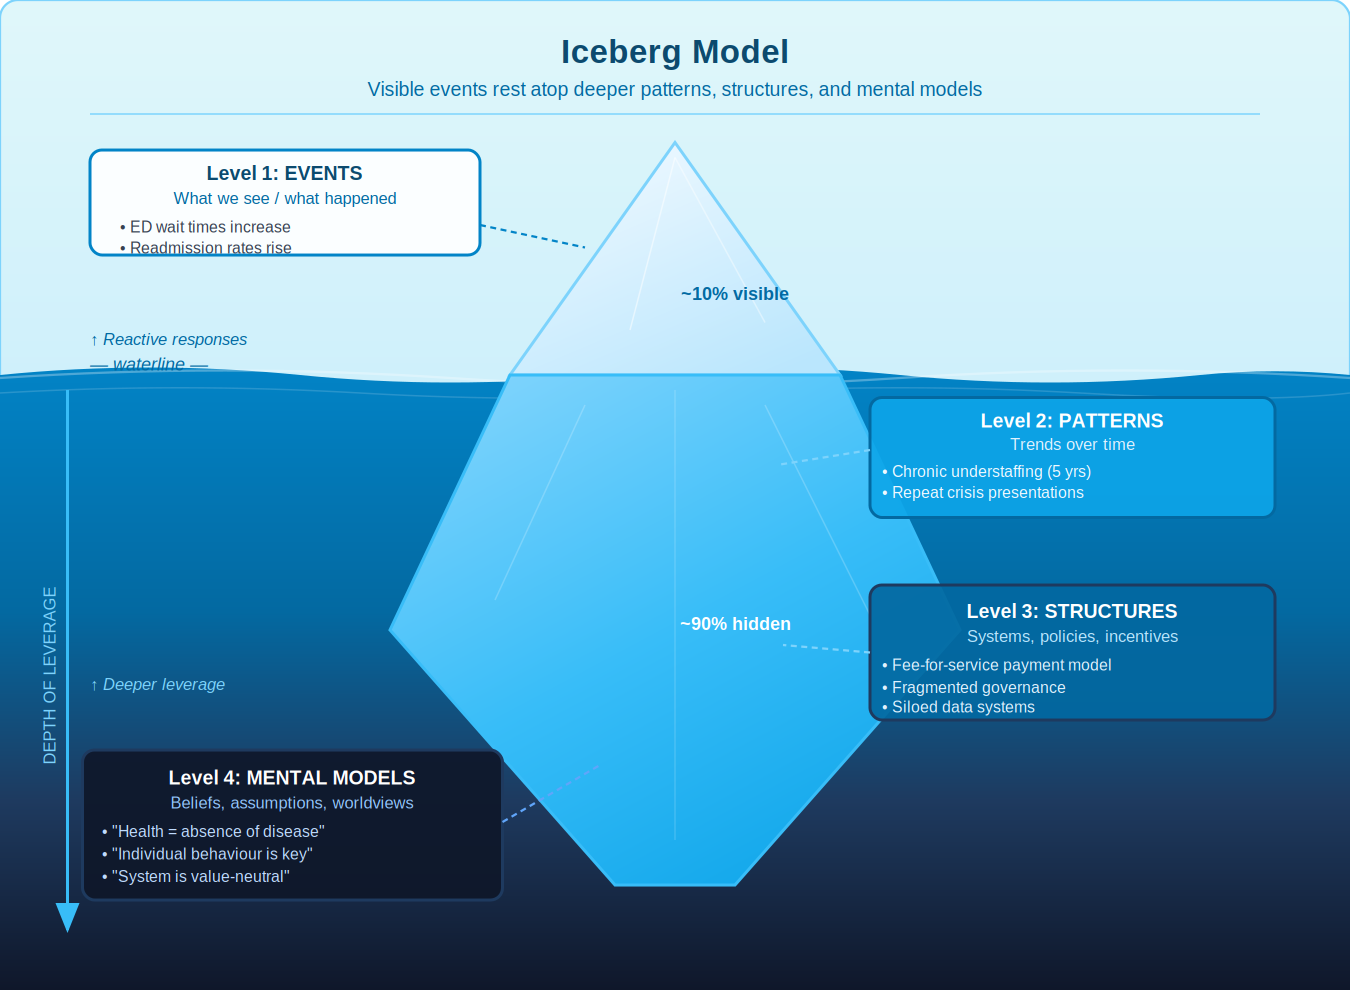
The conventions — which we’ll go through in detail in a future post — are many. There are some misconceptions that system maps are constrained to iceberg models, causal loops, connected circles (or squares), or some form of graphs. There are many, many more. A recent book by Christian Baron (published by Routledge) provides guidance on more than 65 methods of systems thinking that incorporate a wide variety of mapping conventions.
Why undertake these things? Why would we map things when we already can think about systems? The reasons are many:
Greater opportunity to see, express, and communicate what we think about in systems. Our brains can’t retain all the information from a system in a cohesive, organized way. Mapping allows us to do what’s called cognitive offloading, freeing our thinking by putting our thoughts, ideas, and data on a page or screen.
Enlisting other minds and perspectives easily. System mapping is highly collaborative, participatory and engaging with people who have an interest or stake in what is being discussed. By inviting them to be part of the mapping process, you can better bring their perspectives to bear on the situation.
Transcending the linear nature of languages. When we speak — no matter the language - we are constrained by certain rules of grammar. Without these rules, language wouldn’t work. You can’t just randomly arrange verbs, nouns, subjects and objects in a sentence or paragraph and have it make sense. Language is largely linear. Systems mapping allows us to communicate using different visual conventions (including language and words) across different dimensions (time, space, and relations) in ways that language alone cannot.
Speak the same language. Mapping, literal and figurative, allows people to get on the same page, including speaking the same language. As such, with the guidance on symbols discussed below, you can address many of the issues associated with consultation with multilingual populations and groups.
Symbology and representative meaning. Words and symbols, together with proximity (size, shape, colour), can come together in system maps to provide a far richer array of communication tools than language alone. For complex conditions, this also allows for more avenues for insight into causes, consequences, and situations that enable us to design with awareness, care, and potential impact.
Getting Started
Designing with systems is a critical part of making effective, sustainable and impactful innovations. My suggestion is to try simple mapping conventions, sketching and low-resolution tools to begin with. Get accustomed to working with visual thinking and practice and see where it takes you.
There are many ways to do this work and no ‘best’ way, only methods that yield insights that are either useful or not useful. Engaging a strategic design consultant can help (reach out to me if you want assistance setting this up), but no matter what, just try things. The more you begin to utilize tools like system maps, the more you’ll see, the greater the depth of your thinking will become, and the more options you’ll have to set yourself up for designing systems and services that matter most amidst complexity.
Key resources:
Censemaking: Systems Thinking Practice: Starting Out https://censemaking.com/2022/05/11/systems-thinking-practice-starting-out/
Thinking Systematically About Systems Thinking
Baron, C. (2026). Methods for Systems Thinking: 65+ Practical Approaches for Exploring Systems, Perspectives, and Complexity. Routledge.